this post was submitted on 16 Apr 2024
787 points (97.9% liked)
Data is Beautiful
6715 readers
38 users here now
A place to share and discuss visual representations of data: Graphs, charts, maps, etc.
DataIsBeautiful is for visualizations that effectively convey information. Aesthetics are an important part of information visualization, but pretty pictures are not the sole aim of this subreddit.
A place to share and discuss visual representations of data: Graphs, charts, maps, etc.
  A post must be (or contain) a qualifying data visualization.

  Directly link to the original source article of the visualization
    Original source article doesn't mean the original source image. Link to the full page of the source article as a link-type submission.
    If you made the visualization yourself, tag it as [OC]

  [OC] posts must state the data source(s) and tool(s) used in the first top-level comment on their submission.

  DO NOT claim "[OC]" for diagrams that are not yours.

  All diagrams must have at least one computer generated element.

  No reposts of popular posts within 1 month.

  Post titles must describe the data plainly without using sensationalized headlines. Clickbait posts will be removed.

  Posts involving American Politics, or contentious topics in American media, are permissible only on Thursdays (ET).

  Posts involving Personal Data are permissible only on Mondays (ET).
Please read through our FAQ if you are new to posting on DataIsBeautiful. Commenting Rules
Don't be intentionally rude, ever.

Comments should be constructive and related to the visual presented. Special attention is given to root-level comments.

Short comments and low effort replies are automatically removed.

Hate Speech and dogwhistling are not tolerated and will result in an immediate ban.

Personal attacks and rabble-rousing will be removed.

Moderators reserve discretion when issuing bans for inappropriate comments. Bans are also subject to you forfeiting all of your comments in this community.
Originally r/DataisBeautiful
founded 2 years ago
MODERATORS
you are viewing a single comment's thread
view the rest of the comments
view the rest of the comments
You will pay far more taxes. These stats are just based on percentages. The rich pay more in taxes each year than most people will make in their entire lives. As someone who makes a ton of money and pays a crap ton of taxes, the people who make these graphics are clueless idiots.
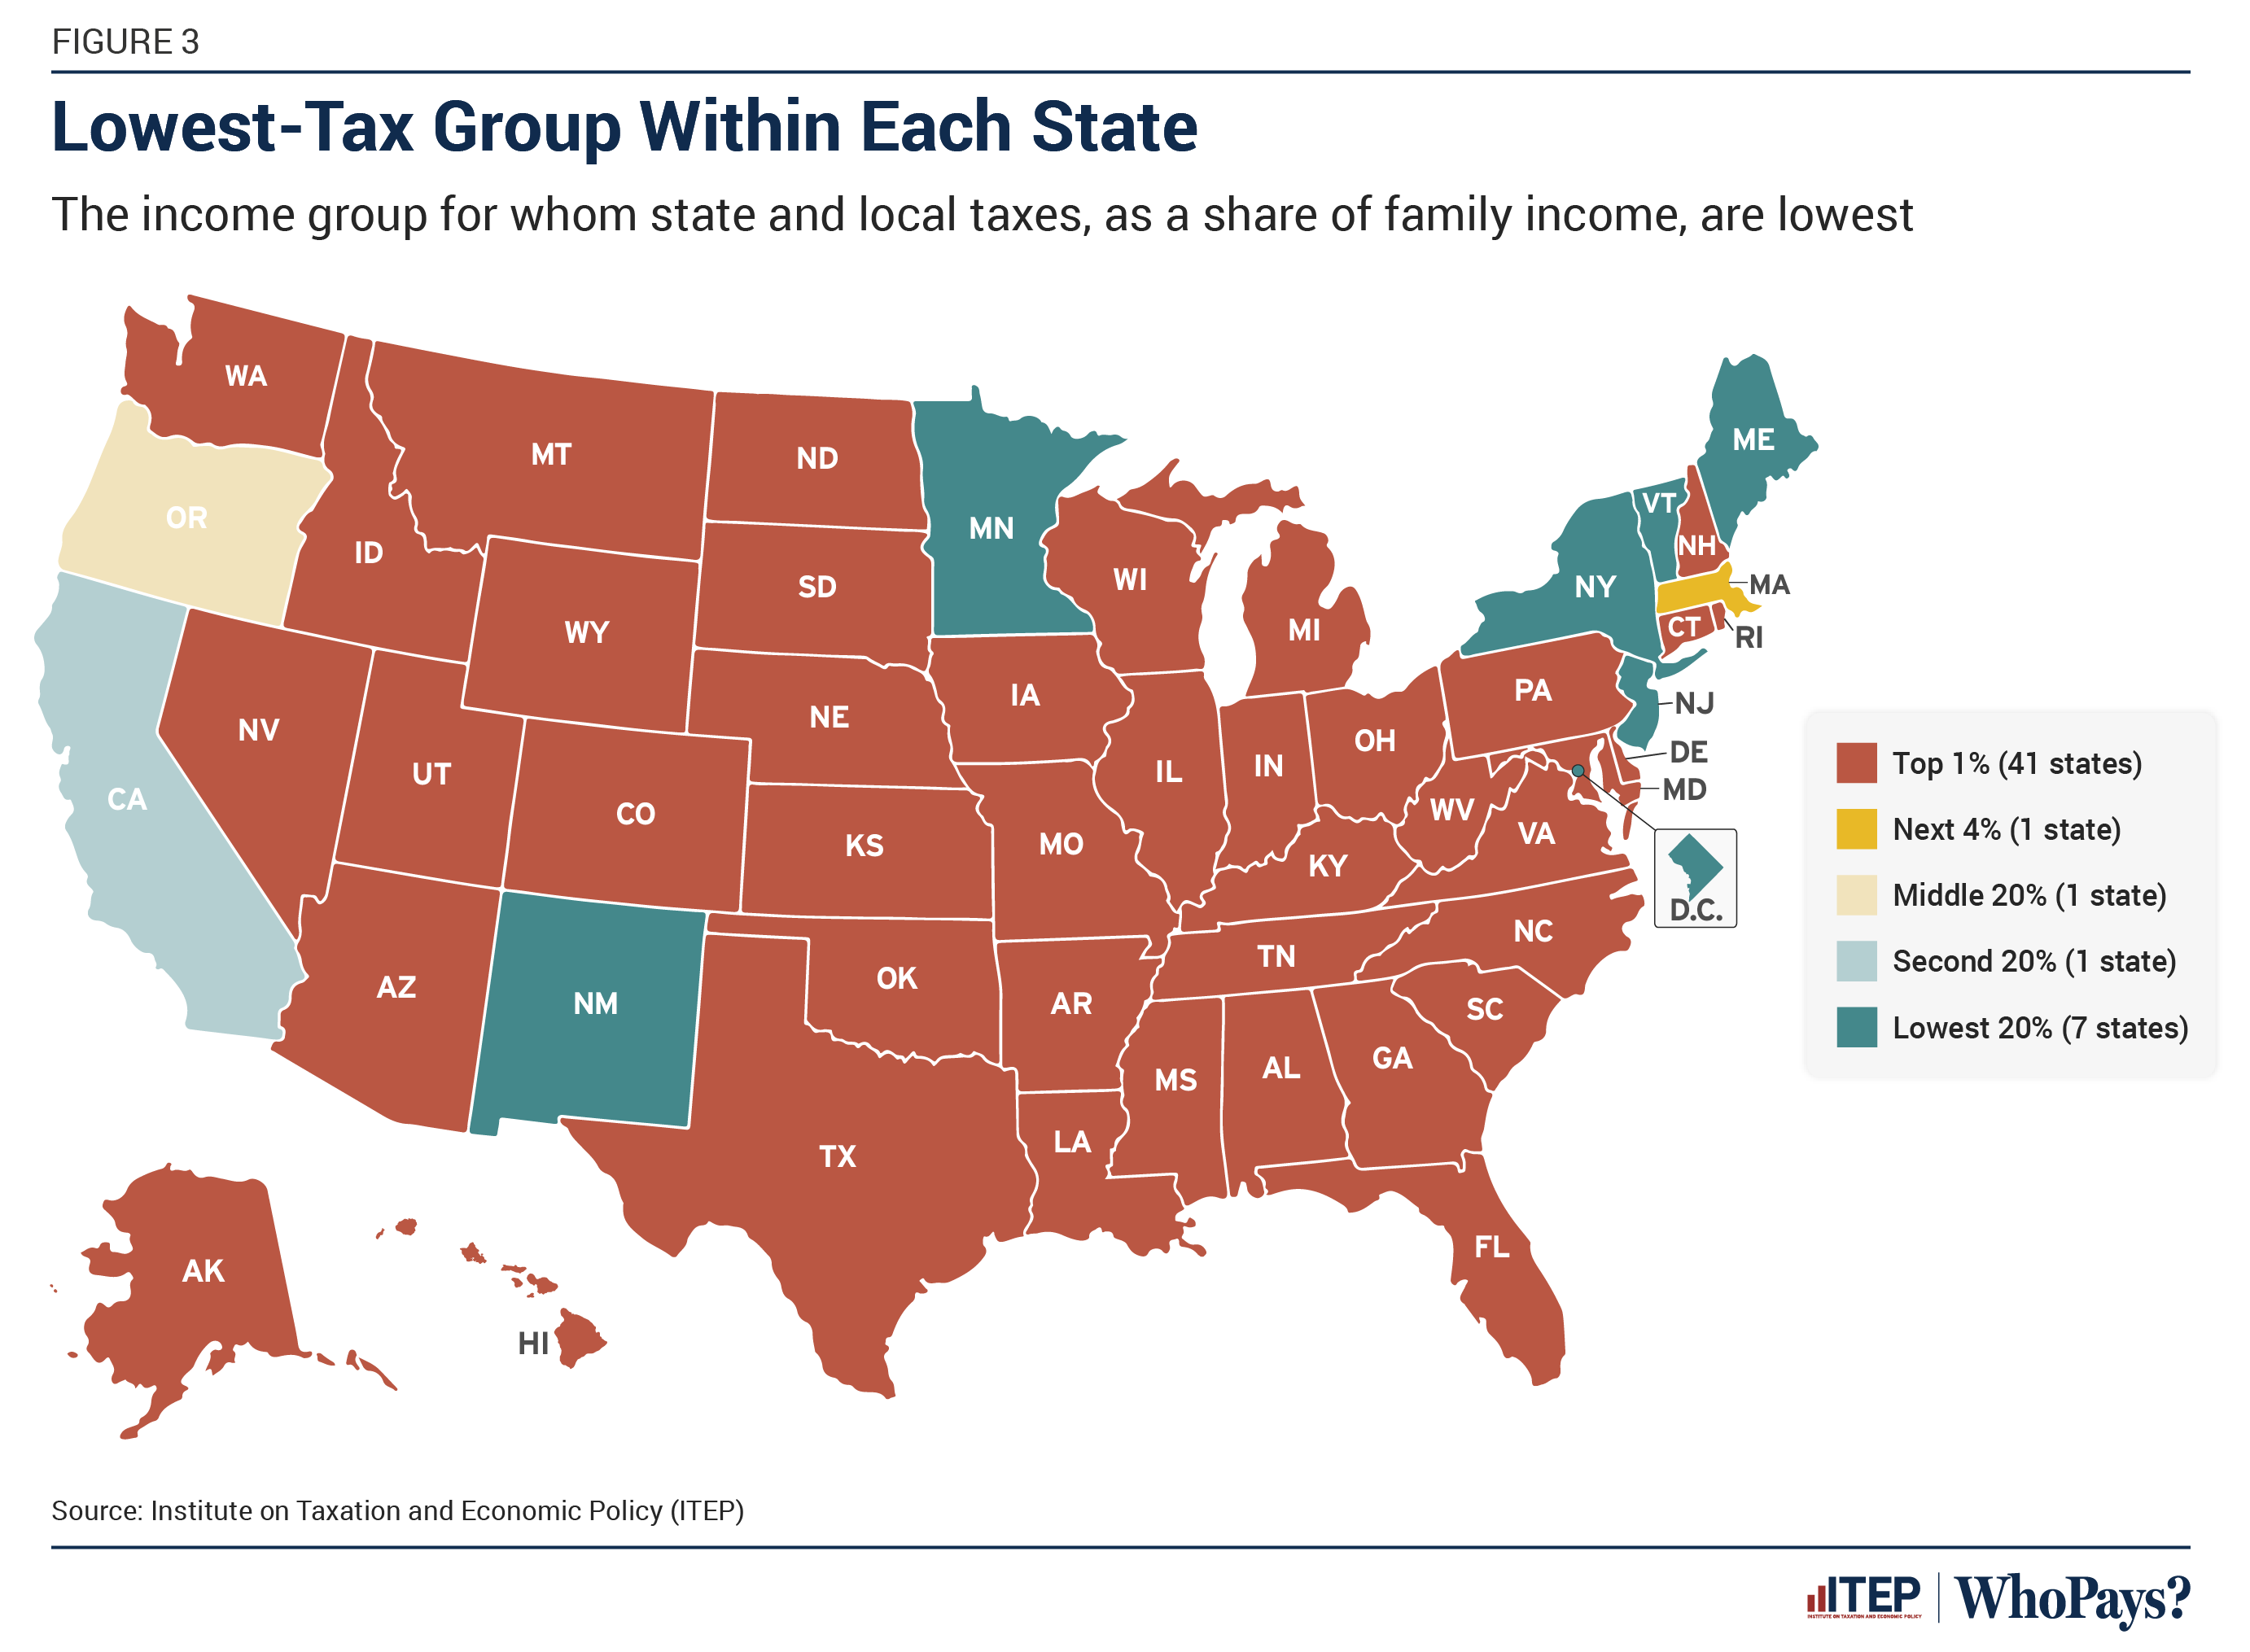
This graphic is based on the percentage of income paid to taxes. A family making $500k a year paying a higher dollar amount than one making $50k a year is expected, but the higher earners should also be paying a higher percentage because 20% to them means a lot less sacrifice than 20% to a low income family. The sacrifice of not buying that third or fourth house is a lot less than whether the low income family goes to the doctor for a checkup.
So you want socialism. No thanks. If I earn $500k a year because I went to college and put in far more effort than someone who makes $50k a year, why should I pay multiples more in taxes than them? Someone earning $50k a year is leaching far more off society than someone making $500k. The $50k per year person buys less and pays less sales tax, they have a far smaller house and pays far less property tax. They will be much more likely to incur medical bills they can't pay. If you have a disability, great, you get assistance (or should), but if you are lazy, why shouldn't you pay the same income tax as me? I pay the tax on everything else that I consume.
Is this a joke? The wealthy consume far more of the efforts of the government than the poor.